Student Questions, Curiosity, and Interest
Case Studies: when do they have value? methods
What is a case study?
A case study is an in-depth investigation of a single person, group, or situation, often used when phenomena are rare or complex.
When are case studies especially useful?
- Rare or unusual conditions where large samples are impractical
- Generating hypotheses for later testing
- Capturing rich context that surveys may miss
What are the main limits of case studies?
- Low generalizability to the broader population
- Potential for observer bias and selective attention
Quick check: Why isn’t a striking case study strong evidence for cause and effect?
Because without control groups and random assignment, alternative explanations are not ruled out. Case studies can suggest causes but cannot isolate them.
Ensuring random sampling is random sampling
What is random sampling?
Random sampling means every member of the population has an equal chance of selection. It supports generalization.
How do you keep random sampling truly random?
- Define the population clearly first
- Use a random number generator or randomizer lists
- Pre-register inclusion and exclusion rules
- Track non-response and compare responders to non-responders
What is external validity?
External validity is the extent to which findings generalize to other people, settings, and times beyond the study.
Quick check: Why doesn’t flipping a coin among volunteers produce a truly random sample?
Because the volunteer pool is already biased. The coin flip is random only within that subgroup, and not everyone in the population had an equal chance to be selected.
Random sampling methods and random assignment sampling vs assignment
What are common random sampling methods?
- Simple random each person has an equal chance
- Stratified sample within key subgroups to match population proportions
- Cluster randomly select whole groups, then include all members in those groups
What is random assignment and why does it matter?
Random assignment places participants into experimental conditions by chance. It balances confounds across groups and supports causal claims.
Quick check: Which helps generalization and which helps causal claims?
Random sampling helps generalization to a population. Random assignment helps causal inference within the study.
Reflection versus observation thinking skills
What is observation in research?
Observation is systematically watching and recording behavior using predefined measures and procedures.
How do reflection and observation work together?
Reflection is for generating questions and ideas. Observation is for gathering publicly verifiable evidence to test those ideas.
Quick check: Why does science prioritize observation when testing ideas born from reflection?
Because observations can be independently verified and replicated, reducing personal bias that can accompany reflection.
What chimpanzees tell us about human psychology comparative
What is comparative psychology?
Comparative psychology studies similarities and differences across species to understand behavior and cognition.
Why compare humans and chimpanzees?
- Insights into social learning, cooperation, and hierarchies
- Evidence of tool use and problem solving as cognitive building blocks
- Awareness of limits due to species differences and environments
Quick check: What can chimp studies tell us about a human behavior and what might they miss?
They can reveal shared capacities or constraints, but may miss culture-specific meanings, language-based reasoning, or human developmental contexts.
More about naturalistic observation and case study methods
What is naturalistic observation?
Naturalistic observation involves watching behavior in typical settings with minimal interference, when ethical and permitted.
When choose naturalistic observation vs. a case study?
Use naturalistic observation to see typical behavior across many people in real contexts. Use a case study to go deep on one rare or complex case.
Quick check: How can observers reduce reactivity in naturalistic observation?
Be unobtrusive, use habituation, and predefine coding schemes. Always follow ethical guidelines and consent requirements.
Survey vs. experiment research design
What is a survey?
Survey research gathers self-reported attitudes or behaviors, useful for large samples and trends but limited for causation.
What is an experiment?
An experiment manipulates an independent variable and measures a dependent variable while controlling confounds, usually via random assignment.
Quick check: Turn “Do phones hurt sleep?” into an experiment.
IV: Phone use before bed (e.g., 0 minutes vs 60 minutes). DV: Sleep efficiency or total sleep time from a tracker. Key: Randomly assign participants to conditions.
Psychodynamics theory
What is psychodynamics?
Psychodynamics emphasizes how unconscious motives, early experiences, and relationship patterns shape thoughts, feelings, and behavior.
What are examples of defense mechanisms?
- Denial: refusing to accept a reality that causes distress
- Projection: attributing your own impulses to others
- Repression: keeping distressing thoughts out of awareness
Quick check: What would count as evidence that a psychodynamic idea is useful?
If it reliably predicts outcomes or improves interventions in controlled studies, with measurable variables and replicable effects.
Week of Sept 22 & 24 — Unit 0: Correlation, Stats Basics & Experimental Design
Schedule: Mon & Wed, 1:45–3:30 pm (10-min break)
Primary text: Myers’ Psychology for the AP Course, 3rd ed.
Key Themes & Focus This Week:
- Scatterplots, correlation coefficient r, positive/negative/zero correlation
- Correlation ≠ causation; third variables; spurious correlations
- Descriptive stats review: mean/median/mode; variability; standard deviation
- Experimental logic: random assignment, control vs. experimental groups, placebo, double-blind
- Research ethics: informed consent, protection from harm, confidentiality, debriefing; animal research basics
Assigned Reading — Myers (3rd ed.)
- Correlation & Experimentation. Scatterplots; correlation coefficient; prediction; illusory correlation; correlation ≠ causation; experimentation logic (random assignment, control).
- Statistical Reasoning in Everyday Life (overview focus). Central tendency (mean/median/mode), variability, standard deviation, normal curve, why outliers matter.
- Ethics & Guidelines. APA/ethical principles: informed consent, minimal risk, confidentiality, debriefing; animal research considerations.
Reading Checks (bring to class)
- Explain in one sentence why correlation does not imply causation. Provide a plausible third variable example.
- Given a skewed distribution, which measure of central tendency is most robust and why?
- Differentiate random sampling from random assignment with one new example each.
Monday, Sept 22
Correlation, Scatterplots & Standard Deviation
Brain Blaster #1 — “Does Ice Cream Cause Drowning?” (10 min)
Two variables increase together—does one cause the other? Identify a third variable that could explain both.
Open: prompts, contrasting answers, exam point
Prompts
- Define correlation; give positive/negative examples.
- Propose a third variable for ice cream ↔ drowning.
Contrasting but justifiable answers
- Yes (initial intuition): More ice cream → more swimming → more drownings.
- No (scientific view): Heat/season drives both; correlation without causation.
Definitive exam point (know this)
- Correlation indicates the degree of relationship between two variables; it does not establish causation.
Mini-lesson A (15 min) Scatterplots & correlation coefficient r; reading strength/direction; outliers & range restriction.
Key takeaway:
- Correlations quantify relationships (–1 to +1); direction ≠ cause; consider third variables and design experiments to test causality.
Mini-lesson A MCQs (answer + explanation)
1) If height and shoe size show r ≈ +0.70, this means:
- Height causes shoe size
- They covary strongly in a positive direction
- They are unrelated
- The relationship is negative
Show Answer
Correct: B. Positive, moderately strong correlation; not a causal claim.
2) If a scatterplot shows a cloud trending down to the right, the best description is:
- Positive correlation
- Negative correlation
- No correlation
- Curvilinear causation
Show Answer
Correct: B. As one increases, the other decreases.
3) The magnitude of r primarily communicates:
- Direction only
- Strength only
- Both strength and direction
- Causation
Show Answer
Correct: C. Sign = direction; absolute value = strength.
4) An outlier that doesn’t fit the pattern will most likely:
- Leave r unchanged
- Inflate or deflate r substantially
- Reverse causation
- Guarantee significance
Show Answer
Correct: B. Outliers can distort correlation estimates.
Brain Blaster #2 — “Spurious or Real?” (10 min)
Give a real-world correlation and argue both sides: a plausible causal story vs. a third-variable account.
Open: prompts & exam point
Prompts
- Practice with weather, time-on-task, sleep, grades
- Name at least one lurking variable
Exam point
- Only experimental control with random assignment supports causal inference.
Mini-lesson B (15 min) Descriptive stats refresh: central tendency & variability; intuitive standard deviation.
Key takeaway:
- Standard deviation captures typical distance from the mean; larger SD = more spread; relates to normal curve interpretations.
Mini-lesson B MCQs (answer + explanation)
1) A distribution with a few very high outliers: which center is most robust?
- Mean
- Median
- Mode
- Range
Show Answer
Correct: B — Median. Less sensitive to extreme values.
2) If class A and class B have the same mean but class B has larger SD, then:
- Scores in B are more tightly clustered
- Scores in B are more spread out
- B has higher mean
- B is normal
Show Answer
Correct: B. Larger SD = more dispersion around the mean.
3) The range is limited as a variability measure because it:
- Ignores all but two scores
- Is always zero
- Requires normality
- Measures causation
Show Answer
Correct: A. Only uses min/max.
4) A roughly normal distribution will have ~68% of data:
- Beyond ±2 SD
- Within ±1 SD
- Beyond ±3 SD
- At the mean
Show Answer
Correct: B. Empirical rule (68–95–99.7) as an approximation.
Micro-Lab — Build a Scatterplot & Estimate r (15–20 min)
Task: Each pair records 10 data pairs (e.g., minutes studied & quiz score), plots a quick scatter, and estimates direction/strength of r. Identify any outliers and how they affect your estimate.
Checklist & Debrief
- Plot points, add a visual trend line.
- Label axes and units; note possible third variables.
- Compare visual estimates across groups; discuss why estimates differ.
AP Exam Key Point: Visual patterns inform hypotheses; statistical summaries (like r and SD) quantify them.
Monday Quiz — Correlation & Descriptive Stats (10 min)
Q1. Give a one-sentence definition of correlation and an example that is positive, negative, or near zero.
Sample Answer
Correlation describes the degree to which two variables change together; e.g., hours practiced and performance may show a positive correlation.
Q2. In one sentence, explain why correlation ≠ causation.
Sample Answer
A third variable or reverse direction could explain the association; only experiments test causal effects.
Q3. Which is less influenced by outliers: mean or median? Why?
Sample Answer
Median—because it depends on order, not magnitude of extremes.
Experiments, Controls & Ethics
Brain Blaster #3 — “What Would Convince You?” (10 min)
Given a strong correlation between energy drinks and lower sleep quality, outline a simple experiment to test causation.
Open: prompts & exam point
Prompts
- IV levels, DV measure, random assignment
- Placebo control & double-blind where feasible
Exam point
- Random assignment (not random sampling) underlies causal inference in experiments.
Mini-lesson C (15 min) Experimental logic: IV/DV, control vs. experimental groups, placebo, double-blind; internal vs. external validity.
Key takeaway:
- Great predictions can arise from correlations, but causal claims require controlled manipulation or strong causal design logic.
Mini-lesson C MCQs (answer + explanation)
1) Which procedure most directly addresses placebo effects?
- Random sampling
- Single-blind
- Double-blind
- Case study
Show Answer
Correct: C — Double-blind. Controls participant and experimenter expectations.
2) Random assignment improves:
- External validity
- Internal validity (causal)
- Construct validity
- Reliability only
Show Answer
Correct: B. Distributes participant differences across conditions.
3) A control group is essential because it:
- Eliminates all confounds
- Creates random sampling
- Provides a baseline without the IV manipulation
- Ensures generalizability
Show Answer
Correct: C. Baseline for comparison to isolate IV effects.
4) The difference between random sampling and random assignment is best captured by:
- Sampling = who’s in the study; assignment = which condition
- Sampling = which condition; assignment = who’s in the study
- Both are about generalization
- Both guarantee causation
Show Answer
Correct: A. Sampling → external validity; assignment → causal inference.
Brain Blaster #4 — “Ethics Under Pressure” (10 min)
Design a stress experiment that respects ethical guidelines but still tests a strong manipulation. Where’s the line?
Open: prompts & exam point
Prompts
- Informed consent, minimal risk, right to withdraw
- Debriefing, confidentiality, deception justification
Exam point
- Ethical safeguards protect participants while enabling valid research.
Mini-lesson D (15 min) Ethics & guidelines: human/animal research; consent, risk, confidentiality, debriefing; when deception is permitted.
Key takeaway:
- Reliable measurement is an ethical issue: clarity in how we measure constructs (variance/SD) supports transparency and fair interpretation.
Mini-lesson D MCQs (answer + explanation)
1) Which principle requires telling participants the nature of the study and their rights?
- Confidentiality
- Debriefing
- Informed consent
- Minimal risk
Show Answer
Correct: C — Informed consent. Participants must know enough to decide voluntarily.
2) Deception is permissible only when:
- It makes results more interesting
- No alternatives exist and risks are minimal; debriefing follows
- Participants are minors
- Confidentiality is waived
Show Answer
Correct: B. Must be justified, low risk, and fully debriefed.
3) Which is most relevant to protecting privacy?
- Confidentiality
- Random assignment
- Double-blind
- Replication
Show Answer
Correct: A — Confidentiality.
4) Animal research ethics most centrally involve:
- Eliminating all lab stress
- Humane care, minimizing discomfort, and scientific justification
- Eliminating all deception
- Paying animals
Show Answer
Correct: B. Ethical standards emphasize humane treatment and clear scientific value.
Group Design Challenge — Causation Test (20 min)
Scenario: Do short mindfulness breaks improve working-memory scores?
- IV: 10-minute guided mindfulness vs. 10-minute quiet sitting.
- DV: Score on a 5-minute digit-span/backward task.
- Ops definitions: Specify audio, timing, environment, instructions, scoring rubric.
- Controls: Room, time of day, device usage, prior caffeine.
- Assignment: Randomly assign; consider double-blind with audio labels.
Ethics Checklist (open)
- Voluntary participation; right to withdraw without penalty.
- Minimal risk; similar to everyday classroom activities.
- Confidential storage of scores; debrief purpose after activity.
FRQ Drill — Design & Validity (10–12 min)
Prompt: Design an experiment to test whether background noise reduces reading comprehension. Include IV levels, DV with operational definition, random assignment, one confound + control, and a note on external validity.
Scoring Guidance
- Testable hypothesis; IV/DV clearly defined (3 pts)
- Random assignment & control condition (3 pts)
- Confound + control strategy (2 pts)
- Validity considerations (2 pts)
Exit Ticket — Wednesday (5–7 min)
- In one sentence, distinguish random sampling from random assignment.
- Name one ethical safeguard you would include in today’s group design and why.
Sample Responses
Sampling selects who enters the study (generalizability); assignment places participants into conditions (causation). Use informed consent to ensure voluntary participation and understanding of procedures.
Week 2 Expansion Pack — Extra In-Class Materials
Extra MCQs — Correlation & Scatterplots
1) A correlation of r = –0.10 indicates:
- Strong negative relation
- Weak negative relation
- No relation
- Strong positive relation
Show Answer
Correct: B. Small negative association.
2) Restricting the range of one variable will typically:
- Leave r unchanged
- Reduce the magnitude of r
- Reverse the sign of r
- Guarantee significance
Show Answer
Correct: B. Less variability obscures relationships.
3) Which best addresses “third-variable” concerns?
- Case study
- Correlational study
- Experimental manipulation with random assignment
- Survey
Show Answer
Correct: C. Experiments isolate causal effects.
Micro-Lab — Standard Deviation by Hand (10–12 min)
In groups, compute SD for two mini datasets with equal means but different spreads; reflect on which class is “more consistent.”
Worked Example (open)
- Set A: 70, 72, 71, 69, 68 (smaller SD)
- Set B: 55, 70, 85, 60, 90 (larger SD)
AP Exam Key Point: SD reflects typical distance from mean; same mean ≠ same variability.
Extra MCQs — Experiments & Ethics
1) A double-blind procedure primarily controls:
- Sampling bias
- Experimenter & participant expectancy
- Social desirability
- Outliers
Show Answer
Correct: B.
2) Debriefing is required especially when:
- Using deception
- Using animals
- Using random sampling
- Using median scores
Show Answer
Correct: A.
3) External validity is primarily about:
- Generalizability beyond the study sample
- Internal causal logic
- Measurement accuracy only
- Replication impossibility
Show Answer
Correct: A.
FRQ Drill — Ethics Scenario (8–10 min)
Prompt: You plan to study sleep restriction and reaction time. Outline consent language, risk mitigation, privacy protections, and a debrief plan.
Scoring Guidance
- Consent: purpose, procedures, rights (2 pts)
- Risk mitigation: minimal risk, stop criteria (2 pts)
- Privacy: secure storage/anonymization (2 pts)
- Debrief: full explanation, resources (2 pts)
Bonus Video Bank (for breaks or make-ups)
Key points:
- Classic spurious correlation example; emphasizes role of third variables like temperature.
- Variance and SD as measures of spread; why SD is preferred over range.
- Intuition for SD: “typical distance from the mean.”
- Correlation quantifies relationships; only experiments can establish cause.
Special Topic: Imaging Human Brain Activity
Intro for students: How can scientists actually see brain activity in a living human? One of the main tools is called functional Magnetic Resonance Imaging, or fMRI. fMRI uses a giant magnet and radio waves to take snapshots of the brain. Instead of showing just the structure of the brain (like a regular MRI), fMRI shows changes in activity while a person is thinking, feeling, or moving.
The key signal that makes this possible is called BOLD, which stands for Blood Oxygenation Level–Dependent contrast. Here’s the basic idea: when neurons in the brain are active, they use more oxygen. Local blood flow increases to deliver that oxygen. Because oxygen-rich blood and oxygen-poor blood affect magnetic signals differently, the MRI scanner can detect those changes. This means we can “see” brain regions light up when they become more active. Importantly, BOLD is indirect — it measures blood flow, not neurons directly.
Science History Timeline — Human BOLD fMRI
- 1990 — Discovery of the signal. Ogawa et al. show in rats that MRI signal depends on blood oxygenation.
- 1991 — Rapid imaging advances. High-speed imaging methods make human applications possible.
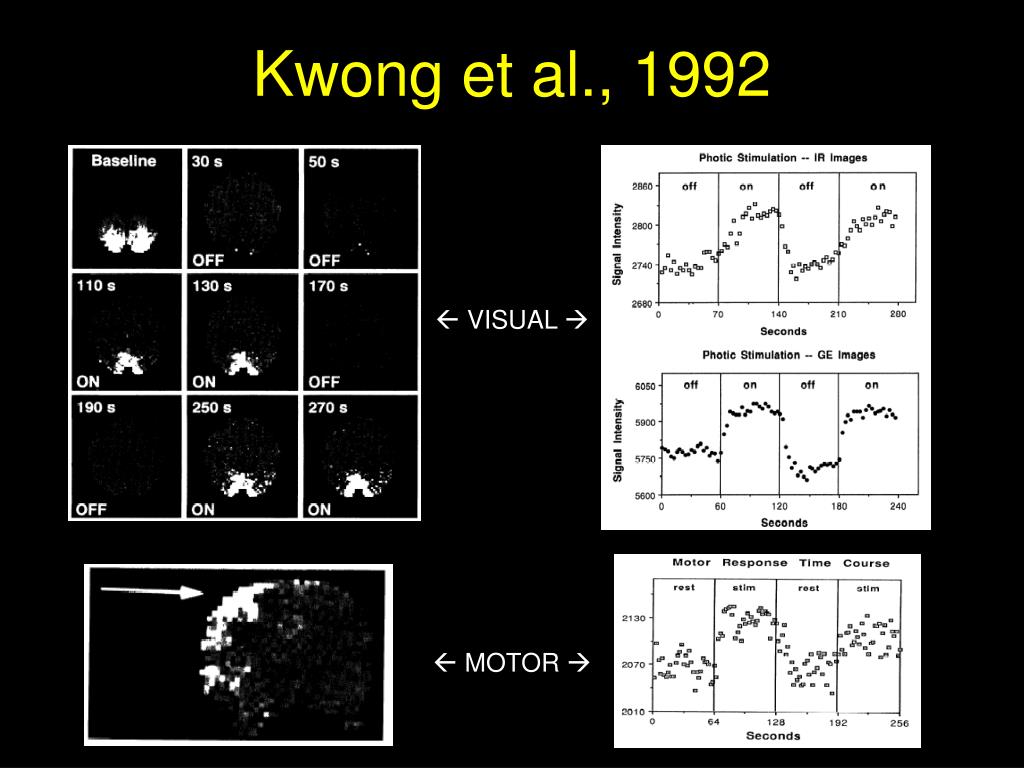
- 1992 — First human fMRI study. Kwong et al., PNAS show visual and motor activation in live humans.
- 1992 — Independent confirmation. Ogawa et al., PNAS demonstrate visual cortex activation in humans.
- 1990s onward. fMRI becomes a standard tool for cognitive neuroscience and psychology.
Featured Human Study — Kwong et al. (1992)
Citation: Kwong, K.K. et al. (1992). Dynamic magnetic resonance imaging of human brain activity during primary sensory stimulation. PNAS DOI | Open Access


Exercises — Correlation vs. Causation in fMRI
Q1. Does the flashing checkerboard cause the BOLD change, or is it just correlated?
Answer
The checkerboard causes neurons to fire, which increases oxygen use, which then causes blood flow changes. fMRI measures those blood changes. So the causation chain is indirect.
Q2. Could another factor (like movement) explain the signal?
Answer
Yes. Head motion or eye movements can produce false signals. Careful controls and data correction are used to rule these out.
Q3. If blood flow goes up, does that prove oxygen use went up equally?
Answer
No. Blood flow usually increases more than oxygen use. BOLD shows the balance, not oxygen use directly.
Q4. A student says “The BOLD signal makes us see.” What’s wrong?
Answer
That flips cause and effect. Neurons cause vision; the BOLD signal is just a way to measure brain activity.
Q5. Why does randomizing ON/OFF blocks make the result more convincing?
Answer
Because random timing rules out simple drift or expectation effects, strengthening the causal interpretation.
Design–Detect–Defend Carousel
A hands-on review of the scientific mindset before descriptive & inferential statistics.
How it Works
- Teams of 3–4 start at a poster/table with one scenario card.
- Round 1 – Design: As a team, outline a study: research question & directional hypothesis, identify IV/DV (or say “correlational”), write an operational definition for the DV, and list controls to reduce confounds. Note any ethics concerns and how you’ll recruit (random sample?).
- Rotate to the next scenario.
- Round 2 – Detect: Critique the prior team’s plan. Flag confounds/bias, fix them, and say whether this should be an experiment (with random assignment) or a correlational study (and why).
- Rotate again to a third scenario.
- Round 3 – Defend: Choose your final design. In one sentence each, preview what descriptive summary you’d show (mean/median/SD, histogram) and what inferential test you’d expect (t-test/correlation/CI/p-value) when we get to stats.
Teacher tip: Give each team a different-colored marker. When posters rotate, you can see which team added which ideas.
What to Produce at Each Station
- 1 Question & directional hypothesis (predict increase/decrease or group A > group B).
- 2 Design choice: experiment (IV levels + random assignment) or correlational (no manipulation).
- 3 Variables: IV(s), DV, and operational definition of the DV (how measured).
- 4 Controls / confounds reduced: time of day, caffeine, prior experience, practice effects, placebo/expectancy, etc.
- 5 Sampling & ethics: recruitment, consent, anonymity, debrief.
- 6 Preview stats: what descriptive display/summary and what inferential test you’d expect to use.
Scenario Cards
1) Energy Drinks & Reaction Time
A student claims an energy drink makes you respond faster in a simple reaction-time game.
Teacher key (ideas)
- Likely design: Experiment; IV = drink type (energy vs placebo), DV = mean reaction time (ms) on 30 trials.
- Operationalize: Average milliseconds on a computerized task; exclude misses >1000 ms.
- Controls: No caffeine 6–8 hrs prior; same time of day; counterbalance order; double-blind with identical cans.
- Confounds to catch: Expectancy/placebo, prior sleep, practice effects.
- Stats preview: Descriptive = mean, SD, histogram; Inferential = independent-samples t-test, p-value, CI; consider effect size.
2) Music & Math Accuracy
Does listening to fast-tempo music help or hurt accuracy on mental-math problems?
Teacher key (ideas)
- Design: Experiment; IV = condition (silence vs fast-tempo), DV = % correct on a 5-minute set.
- Operationalize: Percent correct; same problem set bank randomly assigned; headphones for all.
- Controls: Volume fixed; content instrumental only; counterbalance order if within-subjects.
- Confounds: Music preference, distraction tolerance.
- Stats: Mean/SD; bar chart with error bars; paired t-test (within) or independent t-test (between).
3) Notifications & Working Memory
Do phone notifications reduce digit-span performance?
Teacher key (ideas)
- Design: Experiment; IV = notification frequency (silent vs buzz every 30s), DV = longest correct digit span.
- Controls: Phones face-down; same buzz pattern; practice trial; no messaging content (just vibration).
- Confounds: Anxiety about missing messages, baseline WM differences (random assignment helps).
- Stats: Boxplot/histogram; t-test; discuss effect size and need to replicate.
4) Breakfast & Attention
Students who eat breakfast seem more attentive in first period.
Teacher key (ideas)
- Design options: Correlational survey (self-report breakfast freq vs teacher attention ratings) or experiment (provide standardized breakfast vs no breakfast with consent).
- Confounds: Sleep, SES, sports practice, teacher style.
- Stats: Correlation r for survey; t-test/ANOVA for experiment; emphasize correlation ≠ causation.
5) Color-Coded Notes & Recall
Do color-coded notes improve recall on a 24-term vocabulary quiz?
Teacher key (ideas)
- Design: Experiment; IV = note method (color-coded vs plain), DV = # correct on the quiz.
- Controls: Same study time; same materials; random assignment; blinding graders.
- Confounds: Prior familiarity with color-coding, visual preference.
- Stats: Mean/SD; t-test; consider ceiling effects if many scores near 24/24.
6) Seating & Participation
Do students in the front rows participate more than those in the back?
Teacher key (ideas)
- Design options: Naturalistic observation with an operational definition (e.g., count of voluntary contributions per class); or quasi-experiment by reassigning seats randomly for a week.
- Confounds: Teacher proximity, personality, prior seating norms.
- Stats: If observational, compare means across zones (ANOVA or t-test); ensure inter-rater reliability.
Printable station header (what students see)
At this station, add: 1) Question & directional hypothesis • 2) Design choice (experiment/correlational) • 3) IV, DV, & operational definition • 4) Controls to reduce confounds • 5) Sampling & ethics • 6) Preview: what descriptive display & what inferential test?
Lightning Debrief Prompts
- Design vs correlation: Which scenarios truly needed manipulation and random assignment?
- Operationalizing: Which DV was hardest to measure objectively? How did teams solve it?
- Confounds: What “gotchas” came up most? How would you control them?
- Bridge to stats: For one scenario, which graph and which test would you choose—and why?
Quick Reference: Scientist’s Toolbox
- IV/DV: IV is what you manipulate; DV is what you measure.
- Operational definition: The exact, observable way you’ll measure a variable.
- Random assignment: Spreads pre-existing differences across groups → supports causation.
- Random sampling: Helps generalize to a population (external validity).
- Controls: Hold constant things that could become confounds.
- Placebo/blind: Reduce expectancy effects.
- Ethics: Consent, right to withdraw, minimal risk, debrief.
- Replication: Repeat to check reliability of findings.
Optional Twist (adds movement)
- Sticker flags: Give teams 3 “confound flags.” When they spot a serious flaw on another poster, they place a flag and explain the fix aloud.
- Gallery vote: Class votes on the most replicable design; winner explains their control choices.
Wednesday, Sept. 24, 2025
Learning Targets
- Explain and compute mean, median, mode, range, and standard deviation.
- Understand the normal distribution and the 68–95–99.7 rule.
- Explain what inferential statistics let us conclude from samples.
- Decide whether study results are meaningful or just chance.
Agenda
Warm-up (think–pair–share)
Descriptive stats + video
Normal curve practice (calculator & histogram)
Quick Quiz 1 (projector)
Inferential stats + video
Apply to study blurbs
Quick Quiz 2 (projector)
Exit discussion
Warm-Up (Think–Pair–Share)
Prompt: The class average on a quiz was 75. What else would you want to know to really understand how everyone did?
- 30 seconds solo thinking
- 90 seconds pair share
- Whole-class rapid share-out
Show suggested ideas
- Spread: range or standard deviation (tight vs wide scores)
- Shape/outliers: bell-shaped, skewed, any extreme scores
- Sample size: how many students
- Clusters: multiple peaks (e.g., many 60s and many 90s)
Descriptive Statistics
- Mean = average
- Median = middle score
- Mode = most frequent
- Range = highest – lowest
- Standard Deviation = how spread out the scores are
Show quick checks
- Which measure is most affected by an outlier? Mean.
- Which measure resists outliers? Median.
- What does a small SD suggest? Scores cluster tightly around the mean.
Z-Score (Standard Score): What, Why, and How
What it is: A z-score tells you how many standard deviations a data point is above (+) or below (−) the mean.
Why we use it: To compare scores from different classes/tests/scales, to spot outliers, and to estimate percentiles when data are roughly normal.
Formula (population): z = (x − μ) / σ
Formula (sample): z = (x − x̄) / s
Use μ, σ for known population mean/SD; use x̄, s when you’re working from a sample.
How to Calculate (Step-by-Step)
- Find the mean and SD. (From the problem or computed from your sample.)
- Subtract the mean from your value: (x − mean).
- Divide by the standard deviation.
- Interpret: +z = above average; −z = below average; |z| ≈ 2 or 3 may indicate an outlier (context matters!).
Worked examples (click to reveal)
Example A — Unit test score
Class mean = 80, SD = 10. Your score x = 92.
z = (92 − 80) / 10 = +1.20 → You are 1.2 SDs above average (roughly the 88th percentile if normal).
Example B — Reaction time
Mean = 310 ms, SD = 20 ms. Your time x = 340 ms.
z = (340 − 310) / 20 = +1.50. For reaction times, lower is better, so even though z is positive (above the mean), that’s actually slower than average—always interpret in context.
Example C — Comparing across different scales
Quiz A: x = 18/20, mean = 15, SD = 3 → z = (18 − 15)/3 = +1.00.
Quiz B: x = 44/60, mean = 36, SD = 6 → z = (44 − 36)/6 = +1.33.
Even though 18/20 (90%) looks higher than 44/60 (73%), your relative performance was actually better on Quiz B (z = 1.33 vs 1.00).
When is a Z-Score Helpful
- Comparing apples to oranges: Different tests/scales/classes—z puts everyone on the same SD-based scale.
- Flagging unusual values: |z| ≥ 2 or 3 may mark potential outliers to investigate (measurement error? true extreme?).
- Connecting to percentiles (normal data): You can estimate what % of scores a z-score beats.
Quick z → percentile landmarks (normal curve)
| z | Approx. percentile | Interpretation |
|---|---|---|
| −2 | ≈ 2.3% | Very low relative to mean |
| −1 | ≈ 15.9% | Below average |
| 0 | 50% | At the mean |
| +1 | ≈ 84.1% | Above average |
| +2 | ≈ 97.7% | Well above average |
These are approximations from the empirical rule / normal distribution.
Group Activity: Normal Curve Practice (Calculator + Plot)
Pick a dataset below, then click Load into Calculator. Compute mean and SD, check 68% and 95% coverage, and inspect the histogram + normal overlay.
Datasets
Sleep Hours (20 students)
5.5, 6, 6.5, 7, 7, 7, 7.5, 8, 8, 6, 6, 7, 8.5, 5, 9, 6.5, 7.5, 8, 6.5, 7
Reaction Time (ms, n=18)
315, 289, 302, 340, 298, 276, 331, 309, 293, 287, 360, 305, 297, 320, 301, 312, 295, 338
Quiz Scores (percent, n=22)
68, 72, 75, 75, 76, 78, 81, 82, 84, 85, 86, 88, 89, 90, 90, 91, 92, 94, 96, 97, 99, 100
Or paste your own numbers (comma-separated) in the calculator.
Stats Calculator
Group Discussion Prompts (Projector)
- Which dataset did you analyze
- Mean and standard deviation you found
- Percent within 1 SD and 2 SD (your data) vs 68% and 95% (ideal)
- Is your dataset close to a normal curve Why or why not
Show sample answers (for provided datasets)
Sleep Hours (n=20)
Mean ≈ 6.98, SD ≈ 0.99.
Within 1 SD: 13/20 ≈ 65%. Within 2 SD: 19/20 = 95%.
Conclusion: Close to normal; small-sample noise explains slight differences.
Reaction Time (n=18)
Mean ≈ 309.33 ms, SD ≈ 20.91 ms.
Within 1 SD: 12/18 ≈ 66.7%. Within 2 SD: 17/18 ≈ 94.4%.
Conclusion: Very close to normal; good 68–95 illustration.
Quiz Scores (n=22)
Mean ≈ 85.82, SD ≈ 8.86.
Within 1 SD: 13/22 ≈ 59.1%. Within 2 SD: 21/22 ≈ 95.5%.
Conclusion: Two-SD fits the rule; 1-SD a bit low, hinting mild high-end clumping.
Quick Quiz 1 (Projector)
- Which measure is most affected by an outlier
- Define median in one short sentence
- Mean = 80 with a small SD. What does this suggest about the scores
Show answer key & explanations
- Mean (outliers pull the average).
- Median is the middle score when ordered from lowest to highest.
- Scores cluster around 80 (small SD = tight spread).
Inferential Statistics
- Random sample helps results represent the population.
- p-value is the probability of results this extreme if the null hypothesis were true.
- Statistical significance is often p < .05.
- Confidence interval gives a likely range for the true value.
- Replication repeats a study to see if it holds up.
Show quick checks
- Significant ≠ “important”; it means “unlikely by chance under the null.”
- Narrower confidence intervals = more precise estimates (often larger n).
- Replication guards against flukes/false positives.
Apply It: Do These Results Matter
Anxiety app pilot
Ten volunteers used a breathing app for one week. Anxiety dropped by 2 points on a 40-point scale. No control group.
Mindfulness and GPA
100 students randomly assigned to mindfulness vs study-skills for 4 weeks. Mindfulness GPA +0.3 on average (p < .05).
Music and memory
30 students: music vs no music while studying a 40-word list. Music group remembered +1 word (not statistically significant).
Show model reasoning
Anxiety app: Don’t generalize. No control group; tiny n; change could be placebo, regression to mean. Run RCT.
Mindfulness: Likely meaningful. Random assignment and p < .05 support an effect; discuss effect size (0.3 GPA) and replication.
Music: Not significant. Conclude insufficient evidence, not “no effect.” Consider power and sample size.
Quick Quiz 2 (Projector)
- What does p < .05 usually mean in context
- Why is replication important before drawing strong conclusions
Show answer key & explanations
- If the null were true, there is <5% chance of seeing results this extreme by chance alone; the finding is statistically significant.
- Replication reduces random error and checks if the effect repeats across samples/settings.
Exit Discussion
- One thing you learned about descriptive statistics
- One thing you learned about inferential statistics
- One question you still have
Show sample responses
- Descriptive: “Standard deviation shows spread; small SD = scores cluster.”
- Inferential: “p < .05 means ‘unlikely by chance if null is true,’ not proof of cause.”
- Question: “How big should n be to detect small effects?”
Figures and Memes


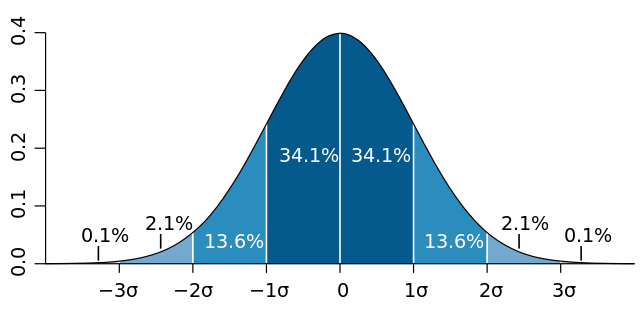


Image credits: Wikimedia Commons (CC BY-SA/GFDL/PD) and xkcd.com.
AP Psychology FRQ Formula Cheat Sheet
Memorize this: D + A = P. Define the term plus Apply it to the scenario equals Point earned. Use full sentences and handle each prompt part in order.
Step-by-step
Quick reference
| What to do | How to earn the point |
|---|---|
| Define | Accurate definition in your own words. Avoid circular wording. |
| Apply | Show how the term explains the scenario. Use the prompt’s names and actions. |
| Write clearly | Full sentences. Specific cause and effect when relevant. No vague “this relates.” |
| Organize | Label parts a, b, c or place each on its own line with the term bolded. |
Worked example
Prompt excerpt Explain how positive reinforcement could increase a student’s study habits.
Definition Positive reinforcement is when a behavior increases because it is followed by a rewarding consequence.
Application If the student receives praise or extra free time after study sessions, that reward makes future studying more likely.
Why this earns the point The answer defines the term and applies it to the prompt’s behavior change.
Common mistakes to avoid
- Only defining the term without applying it to the scenario
- Only applying the term without first defining it
- Vague language such as “this relates to the prompt” without specifics
- Fragments or bullet fragments instead of clear sentences
- Misusing close but incorrect terms such as reinforcement vs punishment
Mini checklist before you submit
- Each required term has a correct definition
- Each term is explicitly applied to the scenario with names or details from the prompt
- Parts are labeled a, b, c and easy to find
- Every sentence is specific and complete
- I avoided extra fluff that does not support the point
AP Psychology — Free-Response Practice (3 FRQs)
Modeled on AP Psychology expectations: define/apply concepts in context, use complete sentences, and address every prompt. Time yourself: ~16–18 minutes per FRQ.
FRQ 1 — Sleep & Memory Experiment
A psychology teacher wants to test whether getting a full night of sleep improves next-day memory for word lists. Students are randomly assigned to either (a) sleep 8 hours or (b) stay up late and sleep 4 hours the night before a recall test. The next day, all students study a 30-word list for 10 minutes and then complete a free-recall test.
Respond to each part in complete sentences:
- Operationally define “memory performance” for this study so it can be measured objectively.
- Identify the independent variable and the dependent variable.
- Explain how random assignment supports cause-and-effect conclusions here.
- Identify one potential confounding variable (other than sleep amount) and describe how the researcher could control it.
- The researcher reports p = .02. Interpret this value in context.
- Both groups have similar standard deviations on the recall test. Explain what that implies about the spread of scores.
Scoring Guide (7 points)
- Operational definition (1): Clear, observable measure (e.g., “number of words correctly recalled out of 30 within 5 minutes”). Must be specific to this study.
- IV & DV (2): IV = sleep condition (8h vs 4h). DV = memory performance as defined above.
- Random assignment (1): Explains that it equalizes preexisting differences between groups, reducing confounds and allowing causal inference about sleep amount.
- Confound + control (1): Names a plausible confound (e.g., caffeine, prior sleep debt, study time, time of testing, noise) and describes a control (e.g., prohibit caffeine, standardize study time/time of day, quiet room).
- p = .02 interpretation (1): If no true effect, there’s ~2% chance of a difference this large just by chance; therefore results are statistically significant at α=.05.
- Similar SDs (1): Score variability/spread is comparable in both groups; differences are in the means, not dispersion.
Note: Credit requires application to the given sleep study, not generic definitions alone.
Model Response (full-credit)
(1) I would operationally define memory performance as the number of words correctly recalled out of 30 within a 5-minute recall period. (2) The independent variable is the sleep condition (8 hours vs 4 hours), and the dependent variable is the recall score as defined. (3) Random assignment puts students into conditions by chance, which helps equalize prior differences (like motivation or baseline memory) across groups, so any difference in recall can be attributed to sleep amount. (4) A potential confound is caffeine intake; to control it, the researcher could prohibit caffeine for 12 hours before testing for all students. (5) A p-value of .02 means that if sleep had no real effect, there is a 2% probability of seeing a difference in recall as large as the one found just by chance, so the result is statistically significant at the .05 level. (6) Similar standard deviations indicate that score spread was about the same in both groups; the main difference is in the average recall, not in variability.
Partial-Credit Example (common pitfalls)
“Memory performance is how well they remember.” (Too vague; not operational.) “We randomly selected students so it proves causation.” (Confuses random sampling with random assignment.) “p=.02 means there’s a 2% chance the hypothesis is true.” (Incorrect; p is about data under the null.)
FRQ 2 — Social Media & Mood (Correlation vs. Experiment)
A school counselor collects data on daily social media minutes and daily mood ratings (1 = very negative to 7 = very positive) from 150 students. The correlation is r = −.60.
Respond to each part in complete sentences:
- Interpret the direction and strength of r = −.60 in this context.
- Explain why this correlation alone does not imply causation.
- Design a true experiment to test whether social media use affects mood. Clearly state the independent variable, dependent variable, and how you will use random assignment.
- Describe how a single-blind or double-blind procedure could reduce expectancy effects here.
- An outlier student reports 720 minutes (12 hours) of use. Explain whether the mean or the median is a better measure of central tendency for social media minutes and why.
Scoring Guide (6 points)
- r interpretation (1): Negative, moderately strong relationship; as minutes increase, mood tends to decrease.
- No causation (1): Could be third variables (stress, sleep), reverse causation, or measurement issues; correlation does not control confounds.
- Experiment design (2): IV = assigned social media limit/condition; DV = mood rating measure; random assignment of participants to conditions; standardized procedures (e.g., 1-week restrictions).
- Blind procedure (1): Explains how single-blind (participants unaware of hypothesis/condition specifics) or double-blind (including raters) reduces expectancy bias/demand characteristics.
- Mean vs median with outlier (1): Median preferred because the mean is pulled upward by extreme outliers like 720 minutes.
Model Response (full-credit)
(1) r = −.60 indicates a moderately strong negative relationship: students with more social media minutes tend to report lower mood. (2) Correlation cannot establish causation because other factors like stress or lack of sleep might cause both high use and low mood, and the data do not control those confounds. (3) In an experiment, I would randomly assign students to either a low-use condition (≤30 minutes/day) or a high-use condition (≥120 minutes/day) for one week, then measure mood with the same 1–7 scale; random assignment helps equalize groups so differences can be attributed to use. (4) To reduce expectancy effects, use a single-blind procedure where participants are told they are in a “digital habits study” without the specific hypothesis, and use blind raters who score mood surveys without knowing condition. (5) The median minutes is better because an extreme outlier (720 minutes) would distort the mean.
Partial-Credit Example (common pitfalls)
“r = −.60 means social media causes bad moods.” (Causation claim.) “I will randomly sample students into conditions.” (Needs random assignment.) “We’ll use the mean minutes even with extreme values.” (Ignores outlier sensitivity.)
FRQ 3 — Normal Curve, z-Score, and Significance
On a district psychology exam, scores are approximately normally distributed with a mean of 80 and a standard deviation of 10.
The district pilots a new study-skills program in one randomly selected class and compares it with a control class.
Respond to each part in complete sentences:
- Alex scores 95 on the exam. Calculate Alex’s z-score and interpret what it means.
- Estimate the percentage of students scoring between 70 and 90 and justify using the empirical (68–95–99.7) rule.
- In the pilot, the program class mean is 84 and the control class mean is 80, with p = .04. Explain whether this difference is statistically significant and what that implies.
- The district reports a 95% confidence interval for the overall mean score as [78, 82]. Interpret this interval in plain language.
- Explain why replication would be important before adopting the program district-wide.
Scoring Guide (7 points)
- z-score (2): Correct calculation: \( z = \frac{95-80}{10} = 1.5 \) (1 pt) and correct interpretation (≈1.5 SDs above the mean; Alex scored higher than most students) (1 pt).
- Empirical rule (1): ~68% between −1 SD (70) and +1 SD (90) with justification referencing the normal curve rule.
- p = .04 interpretation (1): Significant at α=.05; if no true effect, ~4% chance of a difference this large by random assignment; suggests the program may improve scores.
- Confidence interval (1): If we repeatedly sampled, about 95% of such intervals would capture the true district mean; we are reasonably confident the mean lies between 78 and 82.
- Replication (1): Repeating in more classes/schools checks that the effect is reliable and not a one-time fluke or due to unique class factors.
Model Response (full-credit)
(1) z = (95-80)/10 = 1.5. Alex scored about 1.5 standard deviations above the mean, which places Alex higher than the majority of students. (2) Using the empirical rule, about 68% of scores fall within one SD of the mean, so roughly 68% score between 70 and 90. (3) With p = .04, the difference between the program and control classes is statistically significant at the .05 level, meaning that if the program had no real effect, we would see a difference this large only about 4% of the time by chance. (4) A 95% confidence interval of [78, 82] means we are reasonably confident the true district average is between 78 and 82; over many samples, 95% of such intervals would include the true mean. (5) Replication across additional classes and schools is important to make sure the benefit is reliable and not due to unique features of this one class or teacher.
Partial-Credit Example (common pitfalls)
“z = 1.5 means Alex is in the 100th percentile.” (Over-interpretation.) “p = .04 proves the program works.” (p-values don’t prove; they quantify how unusual the data are if the null were true.) “95% CI means 95% of students score between 78 and 82.” (That’s not what a CI means.)
Study Tips
- Underline key terms in the prompt and define + apply each term directly to the scenario.
- Write in complete sentences; bulleted lists alone may not earn full credit.
- For statistics prompts, tie numbers and terms (mean, SD, p-value, confidence interval) to the context.
- Practice under timed conditions: aim for ~10–12 minutes drafting, ~4–6 minutes revising.
Want more practice? Check the AP Psychology Course & Exam Description (CED) on College Board for official FRQs and scoring guidelines, and reputable prep providers for additional practice sets.
Homework: Video Curation, Concept Summaries, Reflection, and a Correlation vs Causation Case Study
Due & Submission
Email by Sunday at 11:59 PM to mferguson@bwh.harvard.edu.
- Include the two video links and your three paragraphs (plus the case-study write-up) in the email body or as a single attached document.
- Suggested subject line: AP Psych HW – [LastName, FirstName] – Videos + Summaries + Tylenol Brief
What to Submit
1) Curate Two High-Quality Teaching Videos (Links)
- Statistics video (1) — A high-quality video teaching a principle (or principles) from our descriptive or inferential statistics modules.
- Study design video (1) — A high-quality video teaching principles of study design (e.g., case studies, observational, experimental), ideally also illustrating confounds and controls.
2) Write Two Short Paragraphs (One per Video)
- Paragraph A – Statistics video:
- 2–3 sentences: concise summary of the video’s content.
- + 2 sentences: define two key concepts from the video in your own words.
- Paragraph B – Study design video:
- 2–3 sentences: concise summary of the video’s content.
- + 2 sentences: define two key concepts from the video in your own words.
3) Write a Reflection Paragraph (6–8 sentences)
In 6–8 sentences, do all four:
- Describe how class concepts are “creeping” into daily life—where you notice them.
- Give a specific real-life example where you applied a class concept.
- Identify situations this year where you might apply a class principle.
- Imagine future scenarios (later education, career, or life) informed by our class principles.
Non-negotiable: Be specific about which principle and why it applies in every part above.
4) Correlation vs Causation Case Study — The “Tylenol Debate”
Time on task: Spend at least 30 minutes exploring current-events coverage and discussion of the “Tylenol” (acetaminophen) debate.
Required deliverable (mini-brief)
- Write a 200–300 word brief explaining how an understanding of correlation vs causation helps interpret the debate.
- Include links to at least two sources you consulted (news, explainer, video, or a research summary).
Guiding questions (use as a checklist while you research)
- What’s the claim? Define the exposure and the outcome clearly.
- What study types are being cited? Observational? Case–control? Cohort? Any randomized evidence? What does each design allow or not allow us to conclude?
- Could it be correlation, not causation? List plausible confounders (e.g., underlying illness, co-medications, health behaviors) and explain how they might create or inflate an association.
- Reverse causality? Could the outcome (or its early symptoms) influence the exposure instead of the other way around?
- Size and context of the effect: Do sources report relative vs absolute risk? Are confidence intervals wide or narrow?
- What evidence would move you toward causation? Think better controls, prospective designs, pre-registration/replication, or other strategies that reduce bias.
- Source quality: Who is making the claim (journalists, advocacy groups, researchers)? Are there peer-reviewed summaries? Any obvious cherry-picking?
How to write the mini-brief (simple structure)
- 1–2 sentences: state the main claim and why it’s debated.
- 3–4 sentences: summarize what kinds of evidence you found and the limits of those designs for proving causation.
- 2–3 sentences: name specific confounders or biases and how they could explain part/all of the association.
- 1–2 sentences: say what additional evidence would clarify causation and why.
Quality & Integrity Checklist
- Videos You previewed several options and selected the best for each category.
- Summaries Each of the first two paragraphs has a 2–3 sentence summary + two concept definitions in your own words.
- Reflection 6–8 sentences addressing all four prompts with specific principles and reasons.
- Tylenol brief 200–300 words + ≥2 source links, focused on correlation vs causation.
- Academic honesty Cite where needed and use your own words; do not copy/paste wording from videos or articles.
Reminder
These video selections will be anonymously peer-graded in a later assignment. Choose content that is accurate, clear, and teaches the principles well.